> ## Documentation Index
> Fetch the complete documentation index at: https://anaconda.com/docs/llms.txt
> Use this file to discover all available pages before exploring further.
# Visualizations and dashboards
Data Science & AI Workbench makes it easy for you to create and share interactive data visualizations, live notebooks or machine learning models built using popular libraries such as Bokeh and HoloViews.
To get you started quickly, Workbench provides sample projects of Bokeh applications for clustering and cross filtering data. There are also several [examples of Workbench projects that use HoloViz here](https://examples.holoviz.org/).
## Create an interactive plot
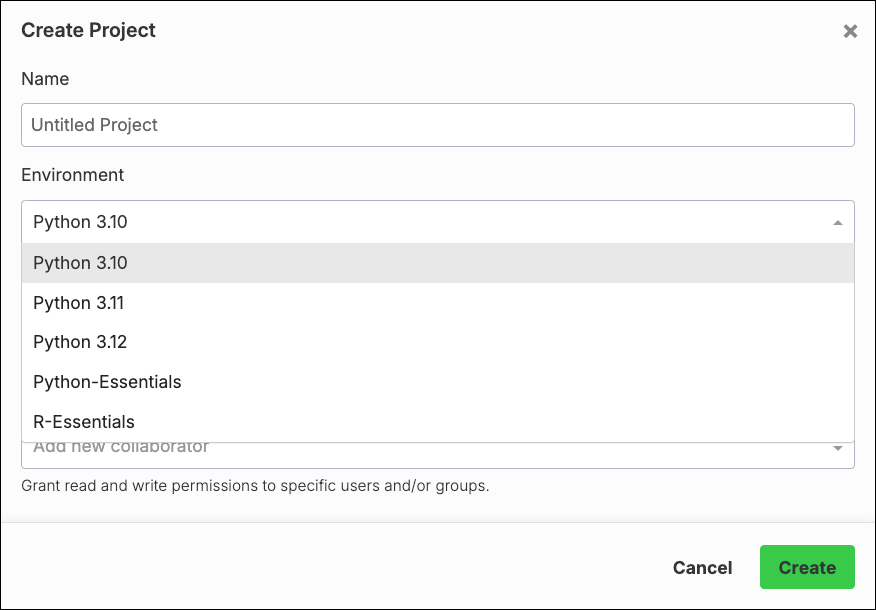
1. From the **Projects** view, create a new project using the minimal Python templates:
 2. Open a session for your newly created project.
3. Open a terminal.
4. Run the following command to install `hvplot` and `panel`:
```
anaconda-project add-packages hvplot panel
```
5. Create a new Notebook and rename it to `tips.ipynb`.
6. Add the following code to `tips.ipynb`:
```py theme={null}
import pandas as pd
import hvplot.pandas
import panel
panel.extension()
df = pd.read_csv('http://bit.ly/tips-csv')
p = df.hvplot.scatter(x='total_bill', y='tip', hover_cols=['sex','day','size'])
pn.panel(p).servable()
```
In this example, the data is being read from the Internet. Alternatively, you could [download](https://raw.githubusercontent.com/mwaskom/seaborn-data/master/tips.csv) the `.csv` and upload it to the project.
7. Open the project’s `anaconda-project.yml` file, and add the following deployment command:
```yaml theme={null}
commands:
scatter-plot:
unix: panel serve tips.ipynb
supports_http_options: True
```
8. [Save and commit your changes](./projects/collaborate#committing-and-pushing-changes).
9. [Deploy the project](./deployments/main).
For a deeper dive into data visualization, follow [this HoloViz tutorial](https://holoviz.org/tutorial/index.html).
2. Open a session for your newly created project.
3. Open a terminal.
4. Run the following command to install `hvplot` and `panel`:
```
anaconda-project add-packages hvplot panel
```
5. Create a new Notebook and rename it to `tips.ipynb`.
6. Add the following code to `tips.ipynb`:
```py theme={null}
import pandas as pd
import hvplot.pandas
import panel
panel.extension()
df = pd.read_csv('http://bit.ly/tips-csv')
p = df.hvplot.scatter(x='total_bill', y='tip', hover_cols=['sex','day','size'])
pn.panel(p).servable()
```
In this example, the data is being read from the Internet. Alternatively, you could [download](https://raw.githubusercontent.com/mwaskom/seaborn-data/master/tips.csv) the `.csv` and upload it to the project.
7. Open the project’s `anaconda-project.yml` file, and add the following deployment command:
```yaml theme={null}
commands:
scatter-plot:
unix: panel serve tips.ipynb
supports_http_options: True
```
8. [Save and commit your changes](./projects/collaborate#committing-and-pushing-changes).
9. [Deploy the project](./deployments/main).
For a deeper dive into data visualization, follow [this HoloViz tutorial](https://holoviz.org/tutorial/index.html).