> ## Documentation Index
> Fetch the complete documentation index at: https://anaconda.com/docs/llms.txt
> Use this file to discover all available pages before exploring further.
# Monitoring cluster utilization
Data Science & AI Workbench enables you to monitor cluster resource usage in terms of CPU, memory, disk space, network and GPU utilization.
**To access the Operations Center:**
1. Log in to Workbench, select the **Menu** in the top right corner and click the **Administrative Console** link displayed at the bottom of the slide out window.
2. Click **Manage Resources**.
3. Login to the Operations Center using the Administrator credentials [configured after installation](/docs/data-science/latest/install/config)
## Total cluster resource utilization
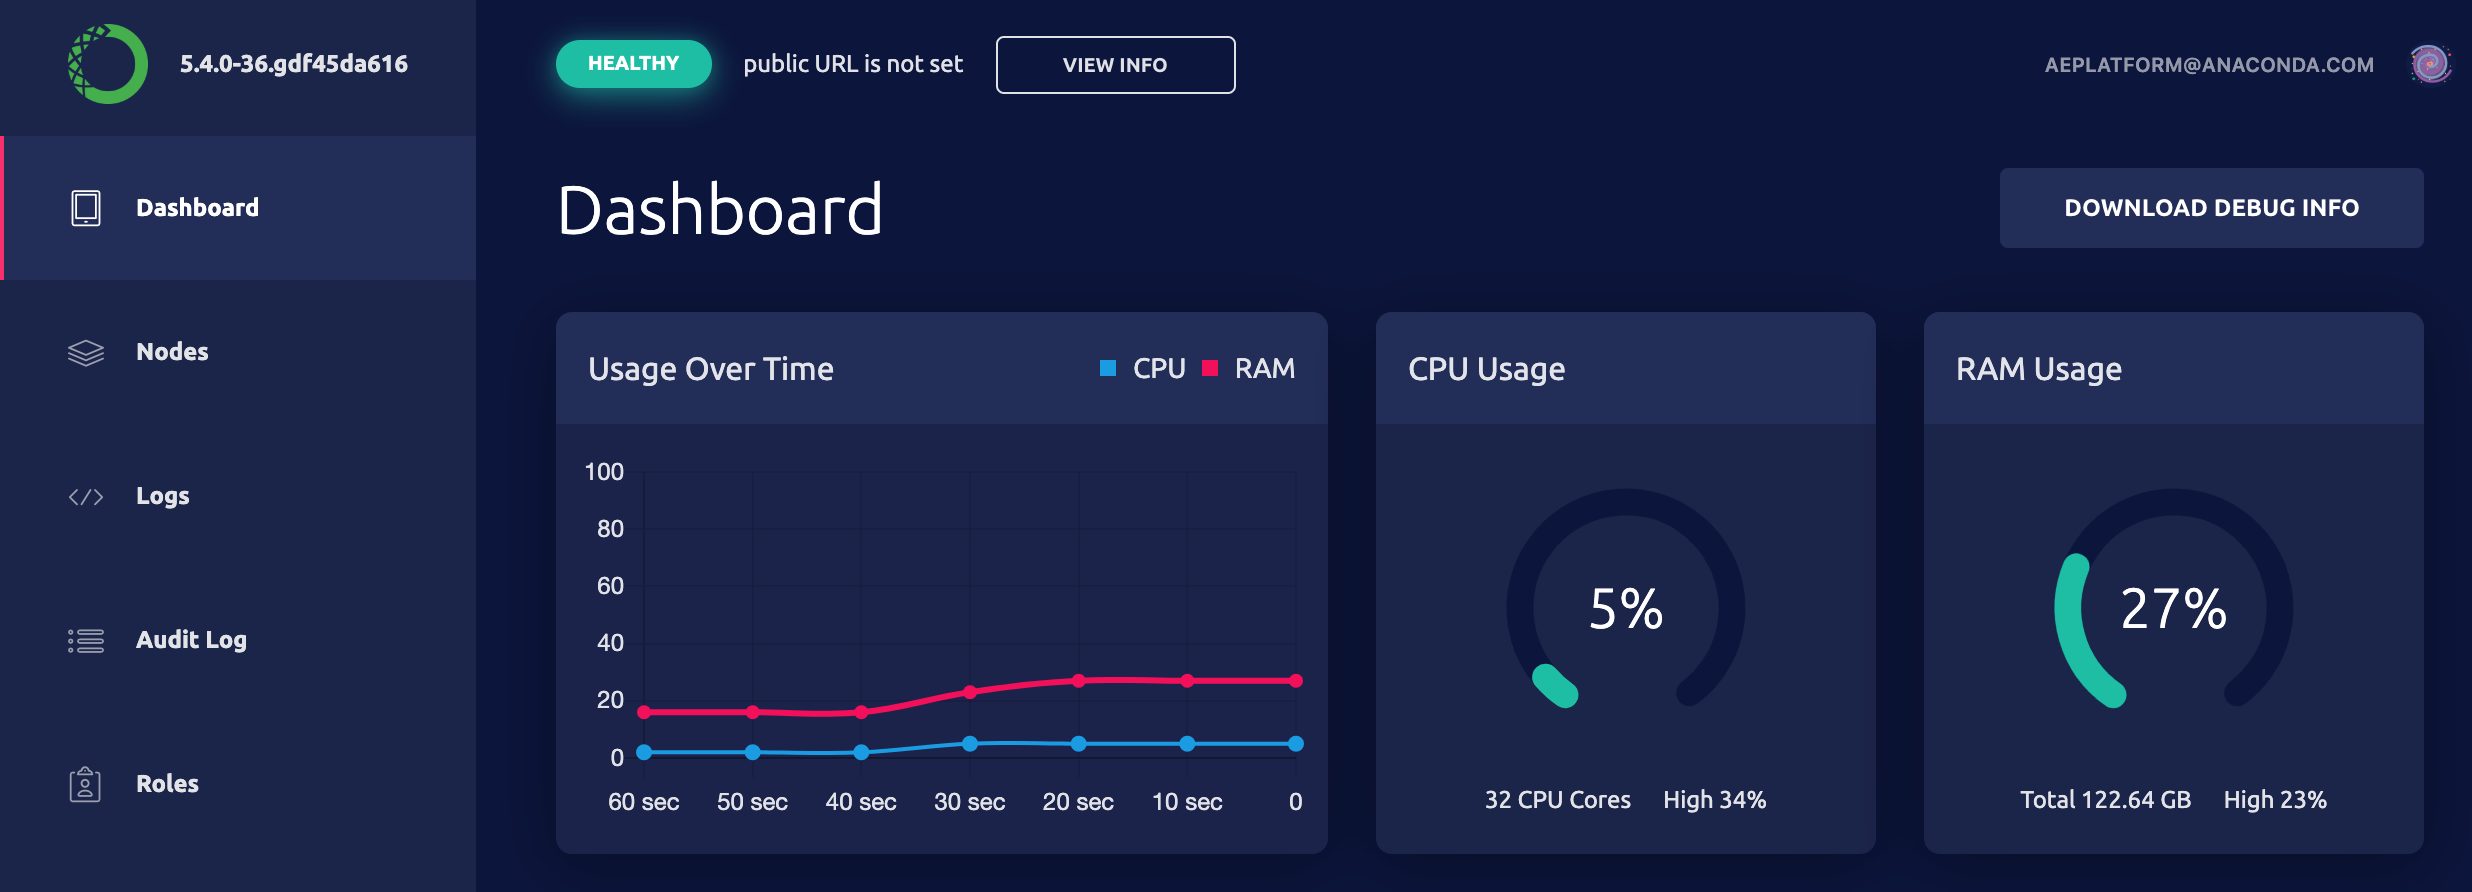
The **Dashboard** tab in the Operations Center displays the total CPU and Memory utilize aggregated across all nodes (master and worker) nodes in the Workbench cluster.
 ## Monitoring dashboard
1. Click **Monitoring** in the menu on the left.
## Monitoring dashboard
1. Click **Monitoring** in the menu on the left.
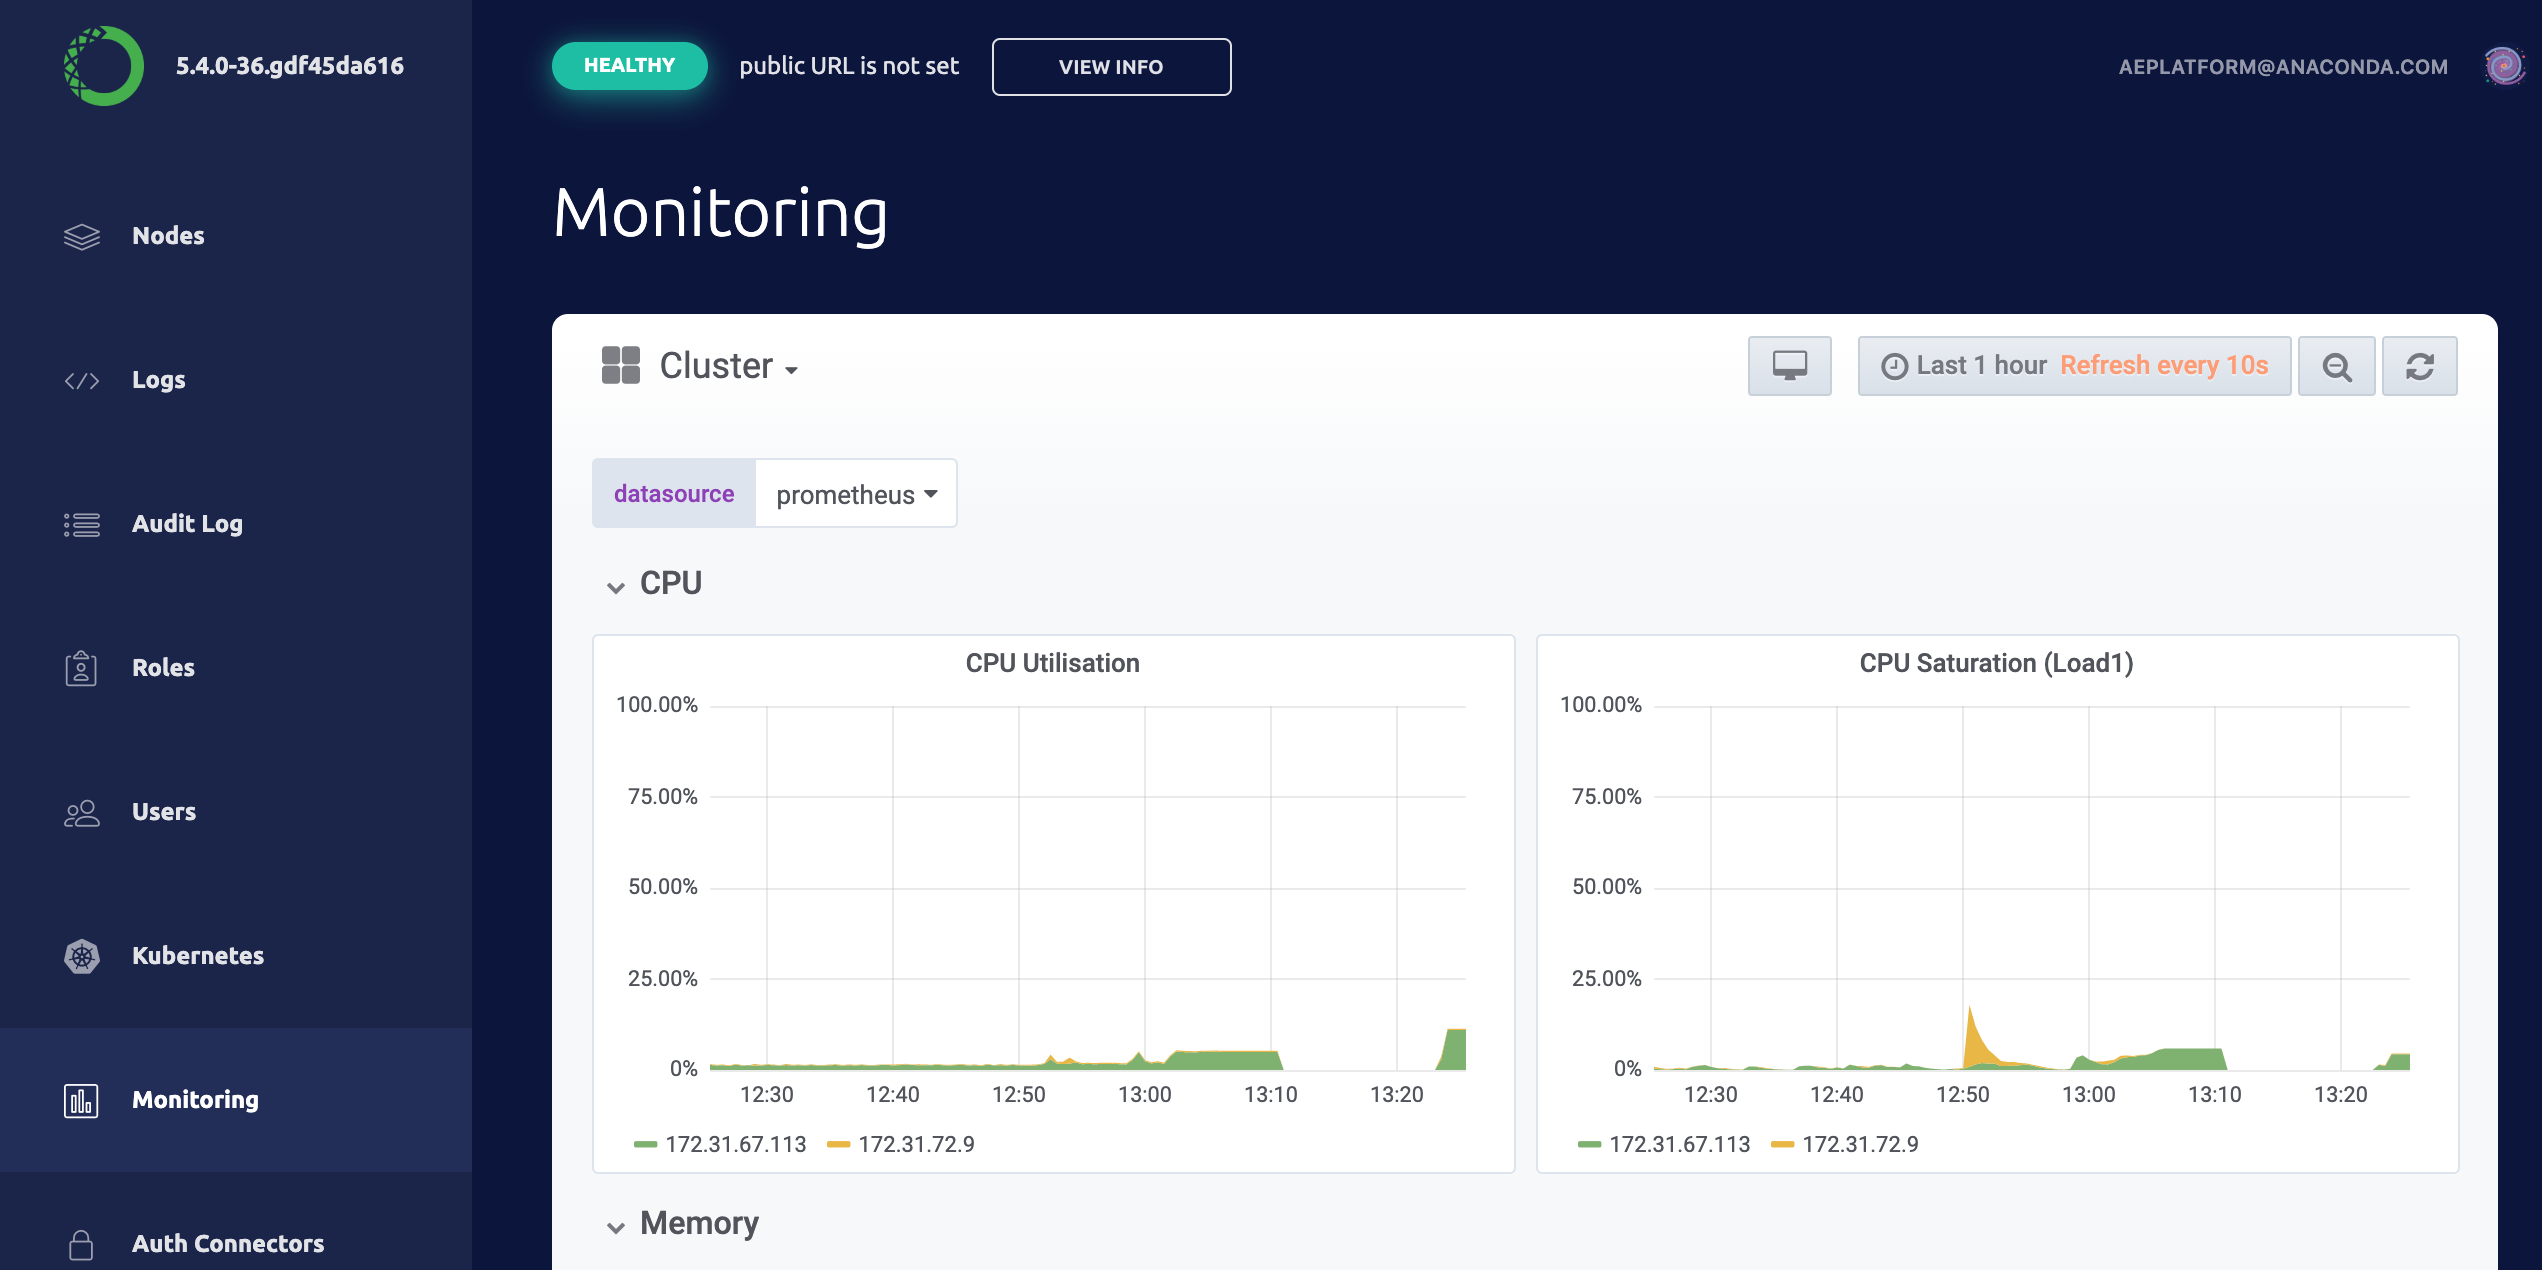 The graphs displayed include the following:
* Overall Cluster CPU Usage
* CPU Usage by Node
* Individual CPU Usage
* Overall Cluster Memory Usage
* Memory Usage by Node
* Individual Node Memory Usage
* Overall Cluster Network Usage
* Network Usage by Node
* Individual Node Network Usage
* Overall Cluster Filesystem Usage
* Filesystem Usage by Node
* Individual Filesystem Usage
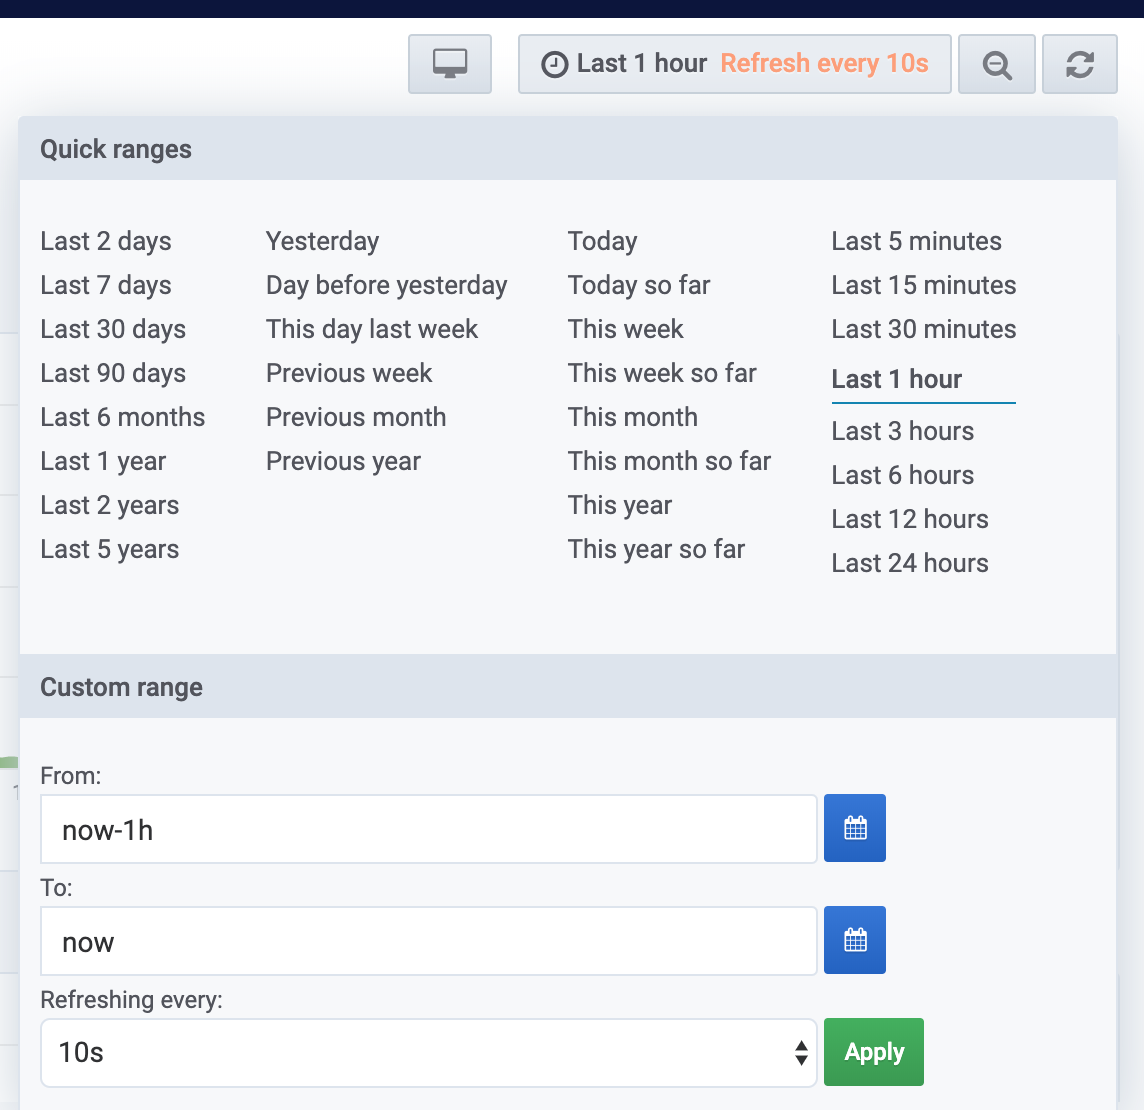
Use the control in the upper-right corner to specify the range of time for
which you want to view usage information, and how often you want to refresh
the results.
The graphs displayed include the following:
* Overall Cluster CPU Usage
* CPU Usage by Node
* Individual CPU Usage
* Overall Cluster Memory Usage
* Memory Usage by Node
* Individual Node Memory Usage
* Overall Cluster Network Usage
* Network Usage by Node
* Individual Node Network Usage
* Overall Cluster Filesystem Usage
* Filesystem Usage by Node
* Individual Filesystem Usage
Use the control in the upper-right corner to specify the range of time for
which you want to view usage information, and how often you want to refresh
the results.
 ## Monitoring Kubernetes
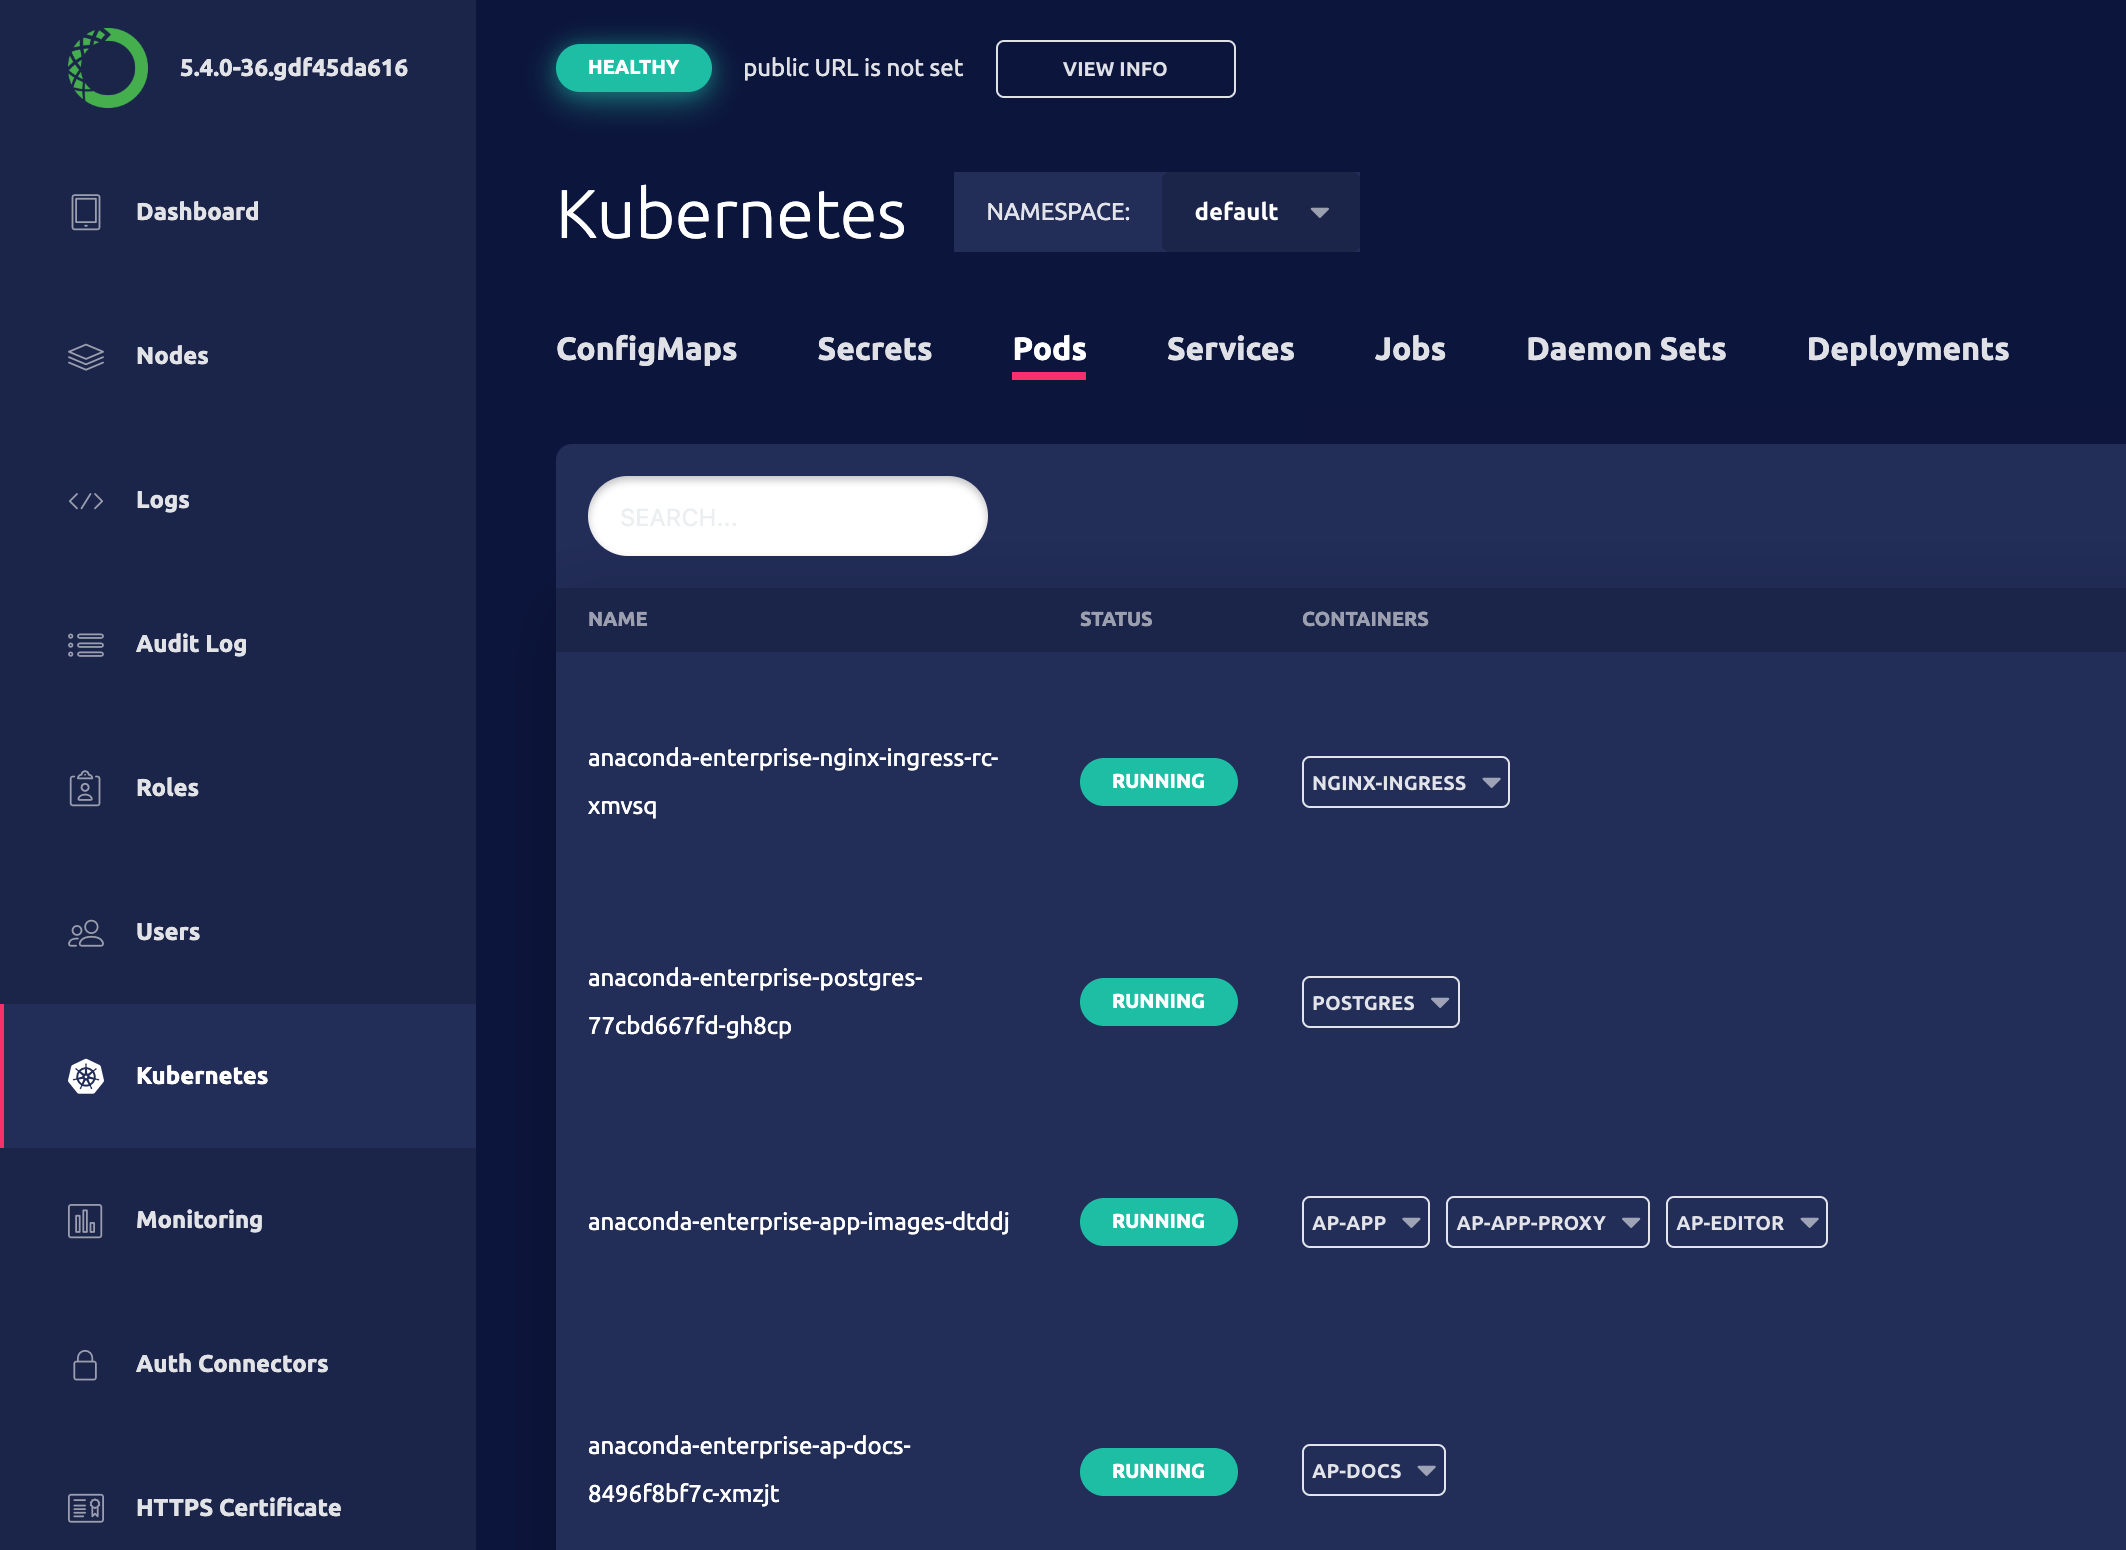
To view the status of your Kubernetes nodes, pods, services, jobs, daemon sets
and deployments from the Operations Center, click **Kubernetes** in the menu on
the left and select **Pods**.
## Monitoring Kubernetes
To view the status of your Kubernetes nodes, pods, services, jobs, daemon sets
and deployments from the Operations Center, click **Kubernetes** in the menu on
the left and select **Pods**.
 See [Monitoring sessions and deployments](./monitor-sessions-deps) for more
information.
To view the status or progress of a cluster installation, click **Operations**
in the menu on the left, and select an operation in the list. Clicking on a
specific operation switches to the **Logs** view, where you can also view logs
based on container or pod.
See [Monitoring sessions and deployments](./monitor-sessions-deps) for more
information.
To view the status or progress of a cluster installation, click **Operations**
in the menu on the left, and select an operation in the list. Clicking on a
specific operation switches to the **Logs** view, where you can also view logs
based on container or pod.