> ## Documentation Index
> Fetch the complete documentation index at: https://anaconda.com/docs/llms.txt
> Use this file to discover all available pages before exploring further.
# Resource consumption
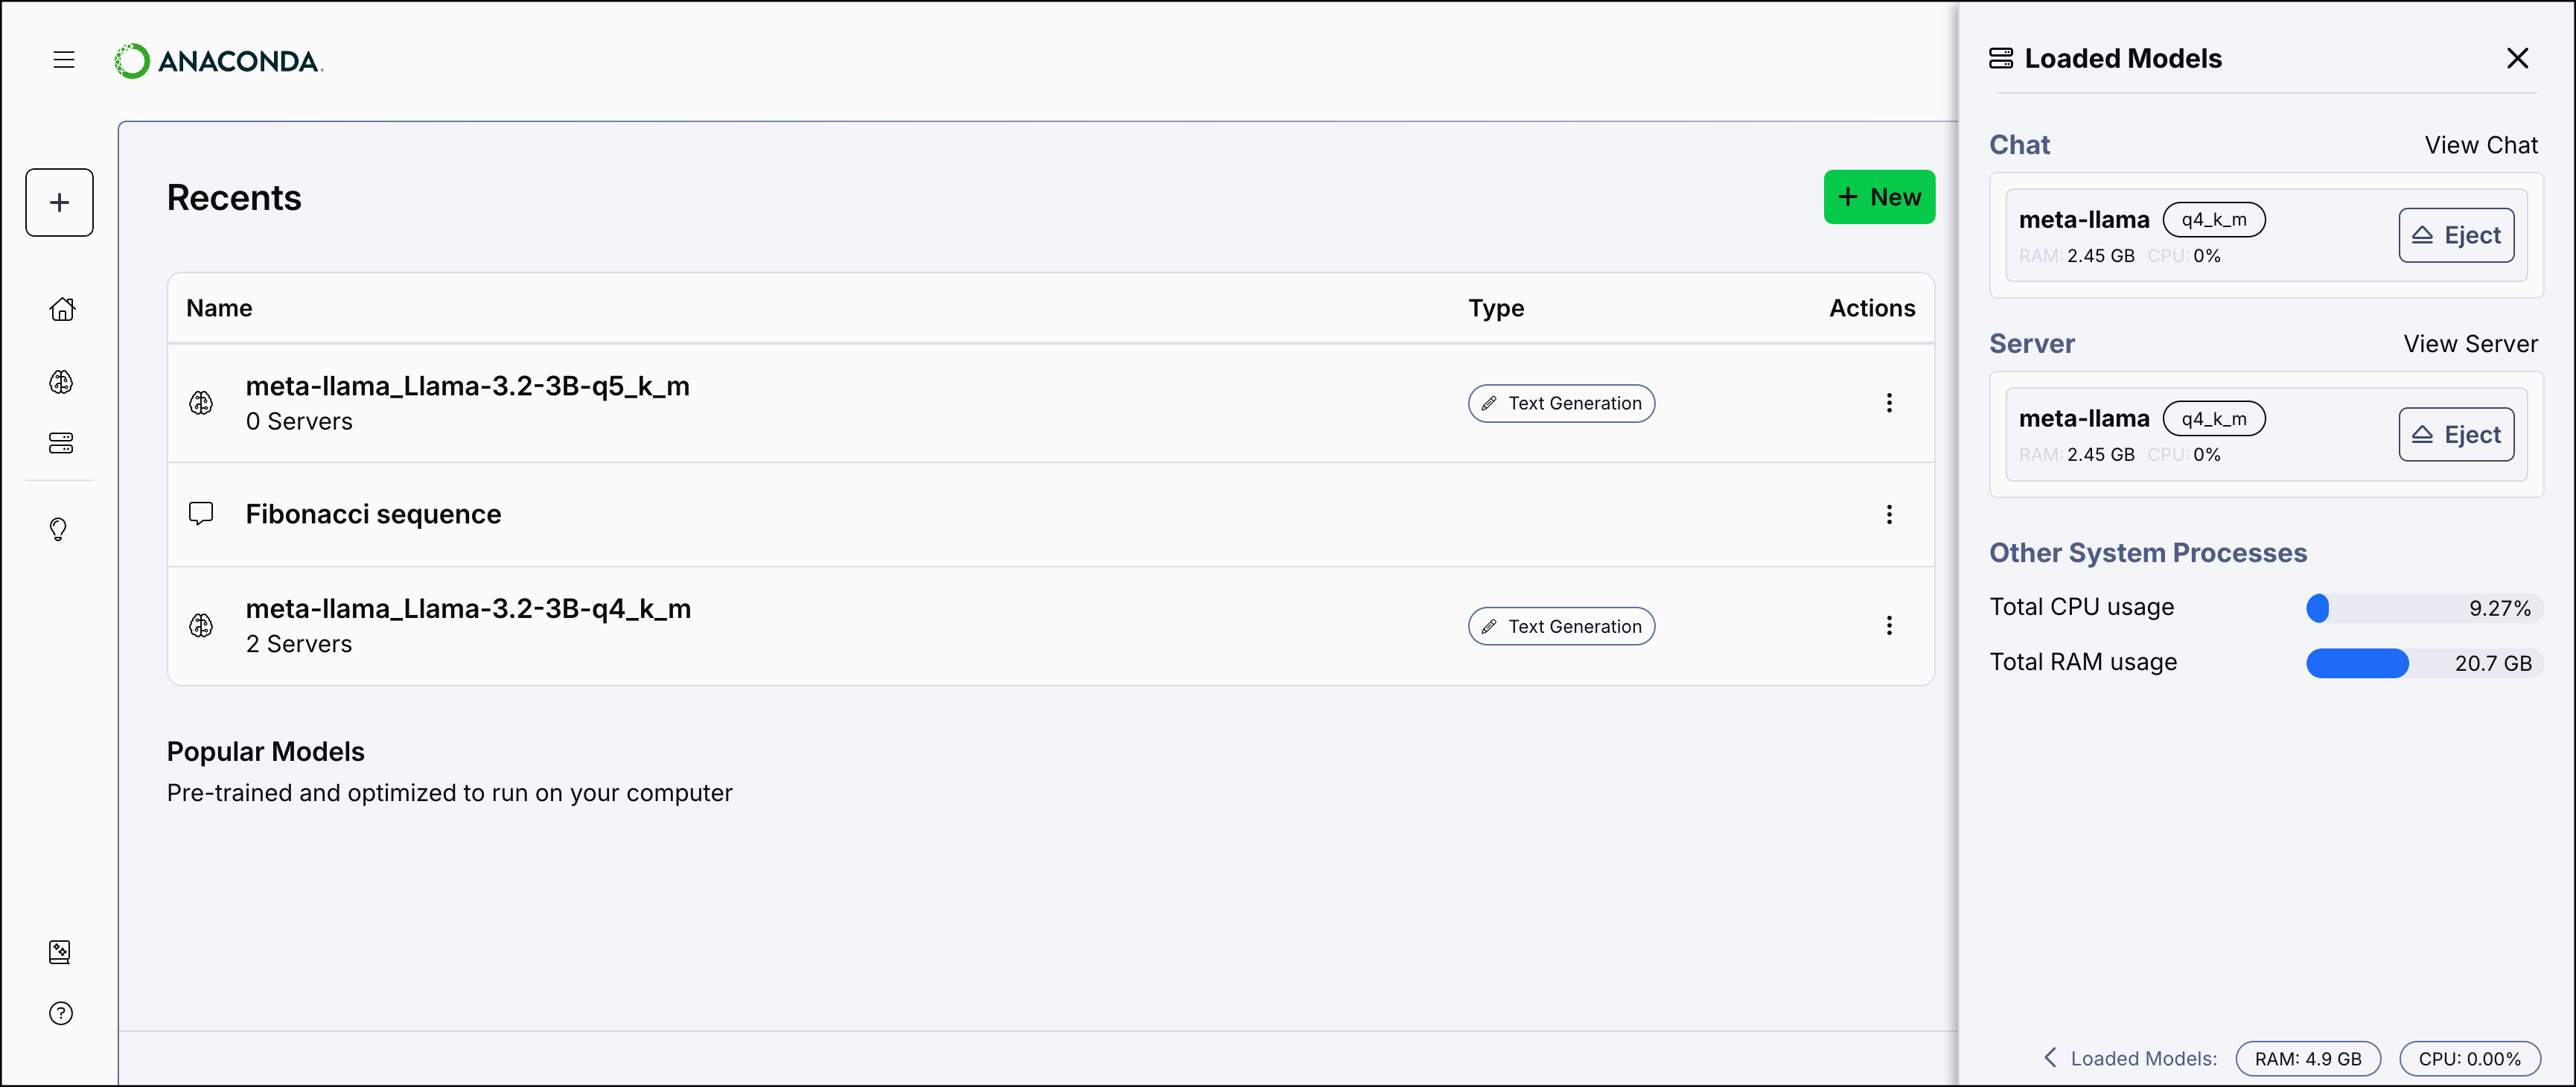
Displayed at all times in the lower-right corner of the application, the resource consumption metrics provide real-time information about your system's CPU and RAM usage, both overall and per loaded model.
If no model is loaded into the API server or chat interface, the metrics display **No Models Loaded**. Loading a model into the API server or the chat interface updates the display to show you how much CPU and RAM the loaded model is currently consuming. Hover over the metrics to display:
* Additional information about how many models are currently loaded
* How much system CPU and RAM you have
* How much is being consumed by the models
* How much is dedicated to other processes (outside of Desktop)
Click **Loaded Models** to open the resource consumption pane. From here, you can see each model loaded into the application, along with metrics showing how many resources each model is consuming. Your system-wide resource metrics are shown below your loaded models. Click **Eject** beside a model to stop the API server or unload the chat interface and free up consumed resources. Click **View Chat** or **View Server** to open the respective view in the application.